Underrepresented Groups Would Save with Part D OOP Cap
Summary
As policymakers continue to consider reforms to the Part D benefit design, an Avalere analysis finds that a disproportionate share of disabled beneficiaries and racial/ethnic minority groups, including Black and Hispanic beneficiaries, would have out-of-pocket (OOP) costs above $2,000 in 2024, indicating that an OOP spending cap under Part D benefit redesign may particularly benefit these patient populations.Over the past few years, policymakers have considered various Part D benefit redesign proposals. Although key parameters of proposals differ, all would implement a beneficiary out-of-pocket (OOP) spending cap, create a new manufacturer discount throughout the benefit, and decrease Medicare’s liability while increasing plan liability in the catastrophic phase. Under the Part D benefit redesign proposal considered as part of the Build Back Better Act (BBBA), beneficiary OOP costs would be capped at $2,000 beginning in 2024.1
Avalere analyzed characteristics of beneficiaries who would have OOP costs of $2,000 or more in 2024 (based on 2019 spending2) and who would therefore likely benefit from a $2,000 OOP spending cap under the BBBA Part D benefit redesign proposal. The analysis finds that certain underrepresented populations, including Black and Hispanic enrollees, would have higher annual average OOP costs in 2024 compared to the Part D population overall and other subpopulations (e.g., White beneficiaries). Similar results were also found for beneficiaries entitled to Medicare on the basis of disability compared to those entitled to Medicare due to age. Additionally, a disproportionate share of beneficiaries who are disabled or from a racial/ethnic minority group would have OOP spending of $2,000 or more.
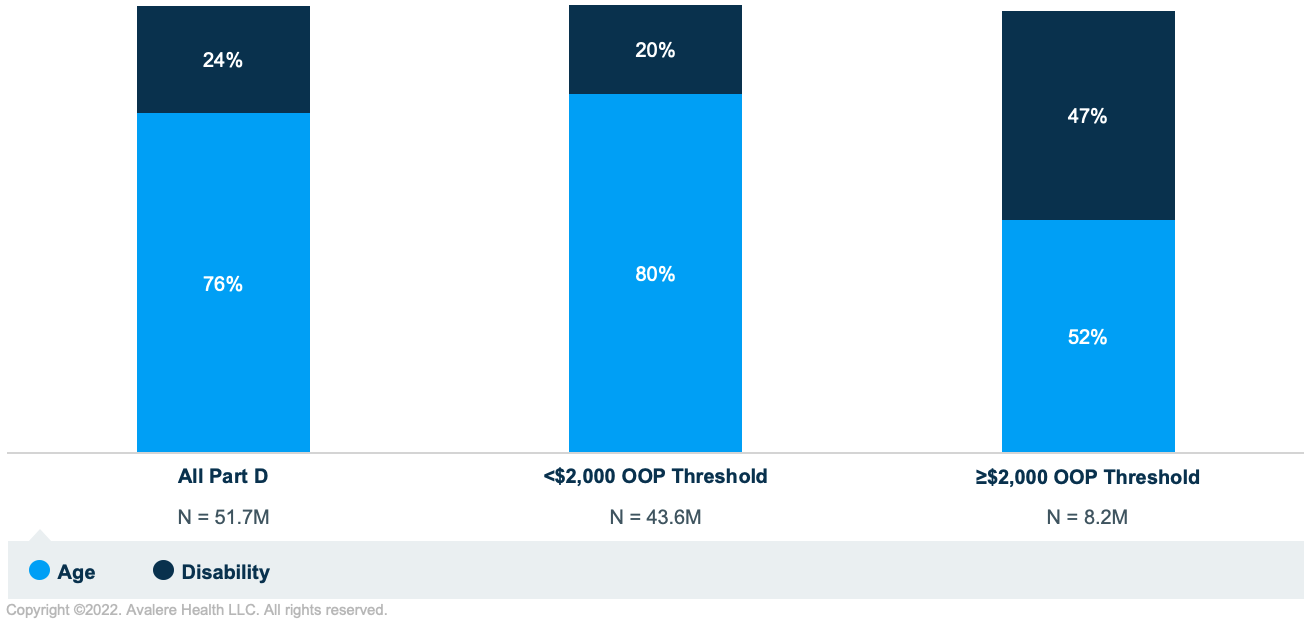
For example, while disabled beneficiaries represent only 24% of the Part D patient population, they make up almost half (47%) of beneficiaries estimated to have OOP spending of at least $2,000 in 2024 (Figure 1). Among all beneficiaries who would have OOP spending of $2,000 or more in 2024, average annual OOP spending for these beneficiaries would be more than 30% higher for those entitled to Medicare on the basis of disability compared to those entitled by age ($6,007 vs. $4,555, respectively).

Note: Beneficiaries with End-Stage Renal Disease were not included in the age or disability category and represented less than 1% of all Part D enrollees and of enrollees with $2,000 or more in OOP costs.
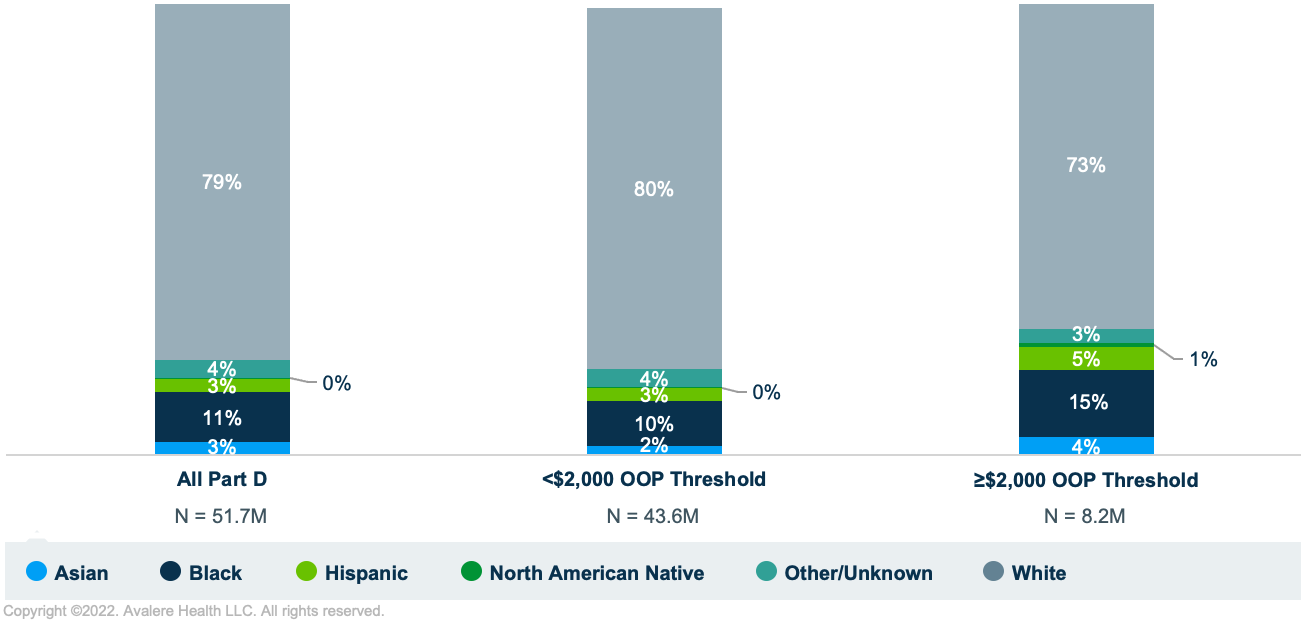
Similarly, while Black and Hispanic beneficiaries represent 11% and 3% of the overall Part D population, respectively, Black beneficiaries make up 15% and Hispanic enrollees comprise 5% of all beneficiaries who were estimated to have OOP spending of $2,000 or more in 2024 (Figure 2).

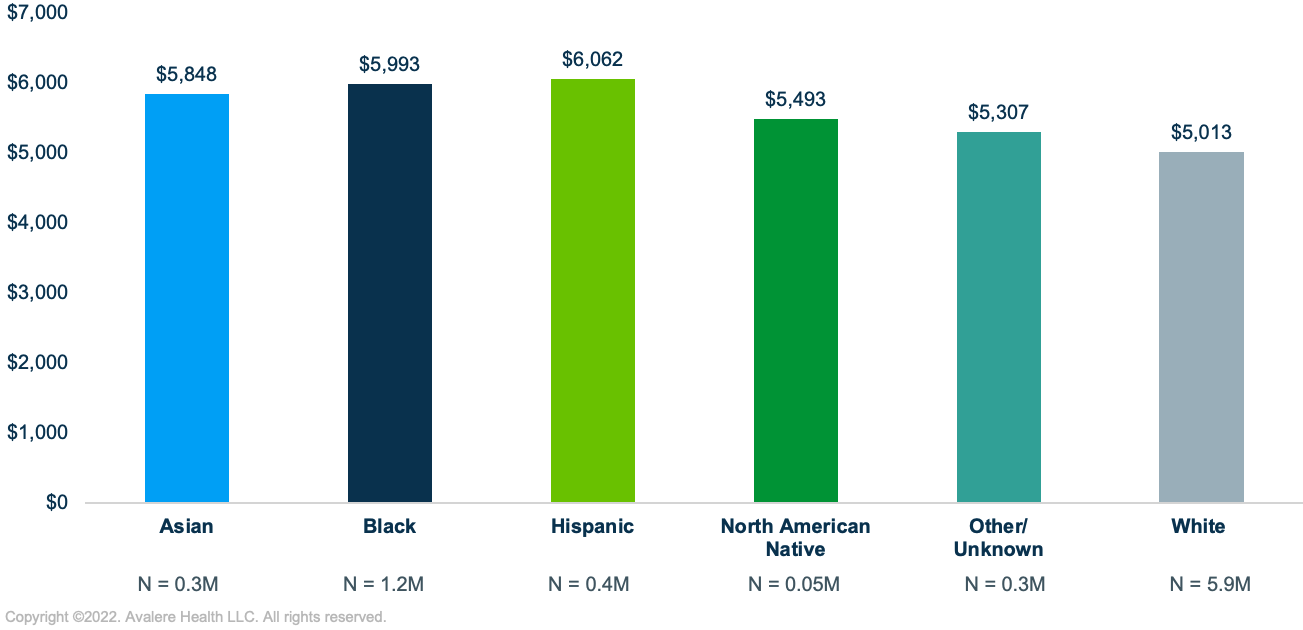
Among all beneficiaries who would have OOP costs of at least $2,000, those who are White were estimated to have average annual OOP costs of just over $5,000 in 2024 compared to average annual OOP costs of about $5,500 or more for beneficiaries who are Asian, Black, Hispanic, or North American Native (Figure 3).

While debate on the BBBA is currently stalled in Congress, Part D benefit redesign remains a key priority among lawmakers, raising the possibility of a scaled-down legislative version, standalone Part D redesign legislation, or other actions to implement drug pricing reforms. As discussion continues, stakeholders with an interest in Part D policy should consider the impact that changes to the Part D benefit parameters would have on disparate subsets of beneficiaries, such as the impact that various OOP cap levels could have on different patient populations.
To receive Avalere updates, connect with us.
Methodology
Avalere used 2019 Medicare Part D Drug Event data accessed under a research-focused data use agreement (DUA) with the Centers for Medicare & Medicaid Services to simulate the Part D benefit for 2024 under current law.
Per the requirement of the DUA, Avalere identified a random sample representing less than 20% of the total Part D population. The sample was scaled to represent the full Medicare Part D population. Avalere excluded the following populations from the analysis: those for whom benefit design data was missing, including those with claims paid by an Employer Group Waiver Plan; those residing outside the 50 states and DC; and those enrolled in the Limited Income Newly Eligible Transition program.
To model the current law benefit design, Avalere deflated 2024 benefit parameters to 2019 dollars using annual percentage increases in Part D per capita benefits to account for policy changes to the calculation of the catastrophic threshold under current law. Avalere assumed 2019 plan-specific formulary coverage, tier placement, and cost sharing. Avalere also used 2019 negotiated prices and assumed scripts were filled at in-network preferred pharmacies in determining beneficiary OOP costs.
Notes
- Analysis does not reflect the most recent Part D benefit redesign bill introduced by Sen. Warnock on April 6, 2022.
- All dollar amounts in this document represent costs in 2024, inflated from 2019 dollars. Avalere assumed that the 2019 distribution of beneficiaries and their spending would remain the same in 2024.
Webinar | Election 2024: What's at Stake for Healthcare?
On August 14 at 1:30 PM ET, Avalere experts and guests will discuss the 2024 elections, exploring the candidates’ health policy approaches and implications for stakeholders.


