COVID-19 Compass
Summary
COVID-19 continues to spread nationwide, and individuals with social risk factors and underlying chronic conditions are at highest risk for severe illness.
Please note: This is an archived post. Some of the information and data discussed in this article may be out of date. It is preserved here for historical reference but should not be used as the basis for business decisions. Please see our main Insights section for more recent posts.
Inovalon’s Population Health Insights: COVID-19 Compass dashboard equips health plans, providers, employers, municipalities, and the general public with the visibility to identify geographic areas with a high prevalence of COVID-19 cases and the most at-risk populations to inform COVID-19-related decisions. While there is no substitute for the local knowledge of disease burden, impact on healthcare facilities, and socioeconomic factors in a particular region, this dashboard serves as a useful component to support entities with their pandemic response efforts during this challenging time.
COVID-19 Compass is part of Population Health Insights, a solution that equips health plans with member-level details for targeted interventions.
Population Health Insights: COVID-19 Compass Dashboard
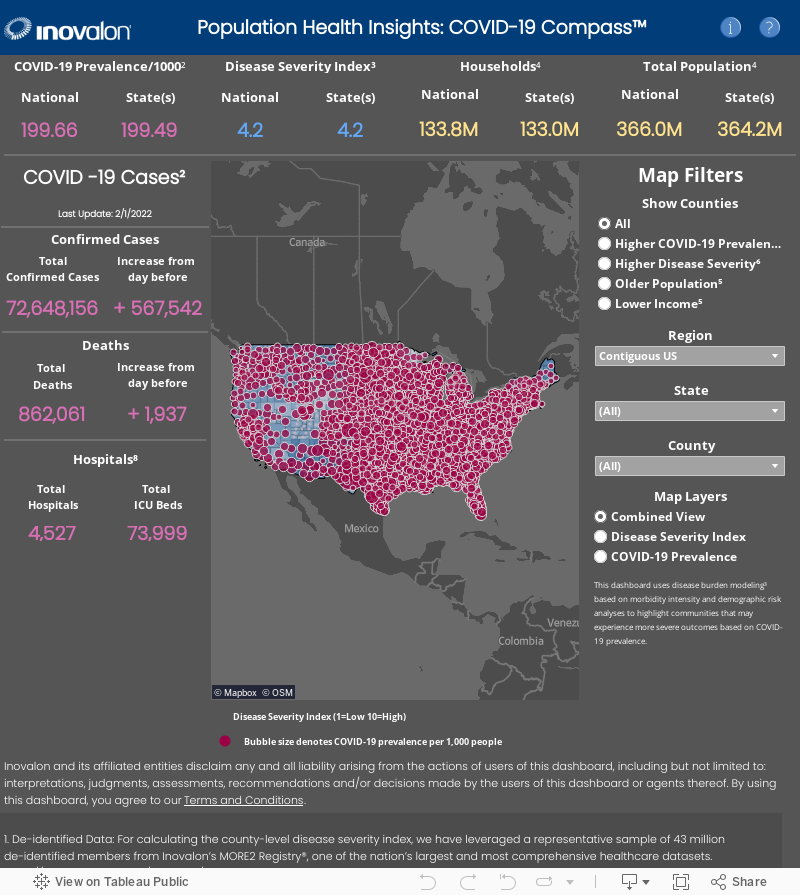
About COVID-19 Compass and Methodology
During the outbreak of COVID-19, Inovalon has utilized Inovalon’s national data connectivity, longitudinal historical data, and real-time data assets pertaining to more than 315 million patients, as well as insights garnered from the scientific community, to analyze factors pertaining to COVID-19’s progression and outcomes. From this, it has become clear that certain underlying pre-existing disease prevalence, when analyzed in combination with social determinant factors, can reveal meaningful insights into the degree of risk with respect to the severity and progression of the virus at the individual level, cohort level, and geographic level.
With the COVID-19 Compass dashboard, Inovalon has leveraged our de-identified MORE2 Registry® of more than 315 million patients and 55 billion medical events to build a representative sample set of the comprehensive clinical data pertaining to approximately 43 million patients. This data is then run through a series of analyses, including the Johns Hopkins ACG® System risk model, and analyzed against contributing comorbidity factors identified by the World Health Organization and the US Centers for Disease Control and Prevention, as well as socioeconomic data. The final analytical result is a near real-time disease risk severity index by county, normalized on a scale from 1 to 10.
This index seeks to model and provide a relevant socioeconomic and underlying clinical condition-adjusted risk analyses to best reflect the increased potential for COVID-19 severity and strain on the health system. The COVID-19 prevalence rate and Inovalon’s disease severity index together provide an additional view that may inform decisions around preventive services, resource allocation, testing, and other activities.
Data Sources
The following data sources have been used in the COVID-19 Compass:
- Inovalon’s MORE2 Registry®
- The Johns Hopkins University COVID-19 Prevalence Data (copyright 2020 The Johns Hopkins University, all rights reserved)
- The Johns Hopkins ACG® System
- Acxiom® Social Determinants of Health Data
- US Census Data
- The Henry J. Kaiser Family Foundation Hospital and Intensive Care Unit Beds Data
How to Get Population Health Insights
COVID-19 Compass is complimentary to the public. For more robust data-driven insights into health plan membership or provider patient mix, Population Health Insights is available for purchase to provide member-level details for targeted interventions to improve health outcomes.
Population Health Insights includes the following dashboards and member-level details:
- Select cohorts and geographies vs. state and national comparisons: Provides a comparison of the prevalence of a selected disease condition within any selected cohort or geography (or set of cohorts and geographies) versus national-level data.
- Chosen condition vs. risk score: Provides a comparison of the prevalence of a selected disease condition by the average risk score within any selected cohort or geography (or set of cohorts or geographies) versus the overall population.
- Chosen condition vs. social determinates of health (SDOH): Provides a comparison of the prevalence of a selected disease condition by SDOH within any selected cohort or geography (or set of cohorts or geographies) versus the overall population.
- Chosen condition vs. demographics: Provides a comparison of the prevalence of a selected disease condition by demographic factors within any selected cohort or geography (or set of cohort or geographies) versus the overall population.
- Chosen customizable analytics vs. any available criteria dimension: Provides a comparison of any custom-requested analytic outcome within any selected cohort or geography (or set of cohorts or geographies) versus any available criteria dimension, such as known and predicted prevalence, patterns, interrelationships, quality, and economics pertaining to patient cohort disease, risk, diagnostics, treatments, outcomes, persistence, costs, and a wide array of additional factors, at patient, provider, facility, geography, and custom cohort levels.
Using this comprehensive view of membership powered by Inovalon’s Population Health Insights, health plans, providers, and accountable care organizations can gain insight into both clinical and non-clinical data to proactively address the dynamic needs of their membership to improve quality outcomes and economics.
About Population Health Insights
The health of a population affects many aspects of a health plan’s success, including quality outcomes, risk score accuracy, case management, and resource allocation. There is a growing consensus that as little as 10% of an individual’s overall health is a result of clinical care—other factors include health behaviors, physical environment, social and economic factors, and biology. However, many health plans lack a holistic view of members, data integration from disparate data sources, and insight into a population’s SDOH. In addition, limited comparative data to evaluate performance against national and regional benchmarks and limited resources for case management programs and interventions present challenges to population health management.
Powered by the Inovalon ONE® Platform, Inovalon’s Population Health Insights brings together advanced analyses of extensive real-time clinical data, social determinants of health data, census data, demographic data, and a multitude of other data elements at the patient, cohort, or local geography level, and regional, state, or national level to provide advanced insights to inform the improvement of healthcare outcomes and economics. This insight enables health plans to identify and assess the needs of various populations to support and inform quality improvement, intervention, and case management programs.
A more comprehensive view of their membership allows health plans to assess not only clinical care but also non-clinical needs to better understand the underlying factors that affect the health of a population. Health plans can then use that data to determine how to address the overall needs of a population to improve health outcomes and reduce the cost of care.
Contact us for more information.
Learn more about Population Health Insights.
Inovalon and its affiliated entities disclaim any and all liability arising from the actions of users of this dashboard, including but not limited to interpretations, judgments, assessments, recommendations, and decisions made by the users of this dashboard or agents thereof. By using this dashboard, you agree to our terms and conditions.
Related Content


Services
From beginning to end, our team synergy
produces measurable results. Let's work together.
produces measurable results. Let's work together.