Medication Adherence in Medically Underserved Areas
Summary
An Avalere analysis explores disparities in medication adherence for Medicare Part D beneficiaries living in medically underserved areas (MUAs) and non-MUAs.Avalere focused on 3 Pharmacy Quality Alliance (PQA)-developed proportion of days covered (PDC) measures: diabetes all class, renin angiotensin system agonists (RASA), and statins.1 The analysis shows that those who qualify for the Low-Income Subsidy (LIS) program more often experience lower medication adherence across the 3 measures than their counterparts who do not have LIS. Additionally, medication adherence trends within LIS groups are worse in MUAs compared to non-MUAs. Similarly, the analysis finds that those who are racial minorities more often experience lower medication adherence across 3 chronic diseases than their counterparts who are not from a racial minority group. Notably, medication adherence trends within racial groups are consistent in both MUAs and non-MUAs.
Low medication adherence is linked to out-of-pocket costs,2 clinical side effects,3 and certain social risk factors.4 To explore how these factors converge, Avalere analyzed rates of medication adherence across race and socioeconomic groups of Part D beneficiaries living both in and out of MUAs. MUAs are geographic areas designated as having a lack of access to primary care. The analysis examined groups of beneficiaries by race—Asian, Black, Hispanic, North American Native, and White—following the Medicare Part D claims data structure. The analysis also assessed beneficiaries by level of LIS, including full LIS, partial LIS, and non-LIS.
Avalere utilized the PQA PDC scores as a measure of adherence. According to the PQA, a PDC of at least 80% is recognized as the threshold above which a beneficiary is reasonably likely to receive the most clinical benefit from a medication. Avalere refers to achievement of a PDC score of 80% or more as “sufficient adherence.”5
LIS Status
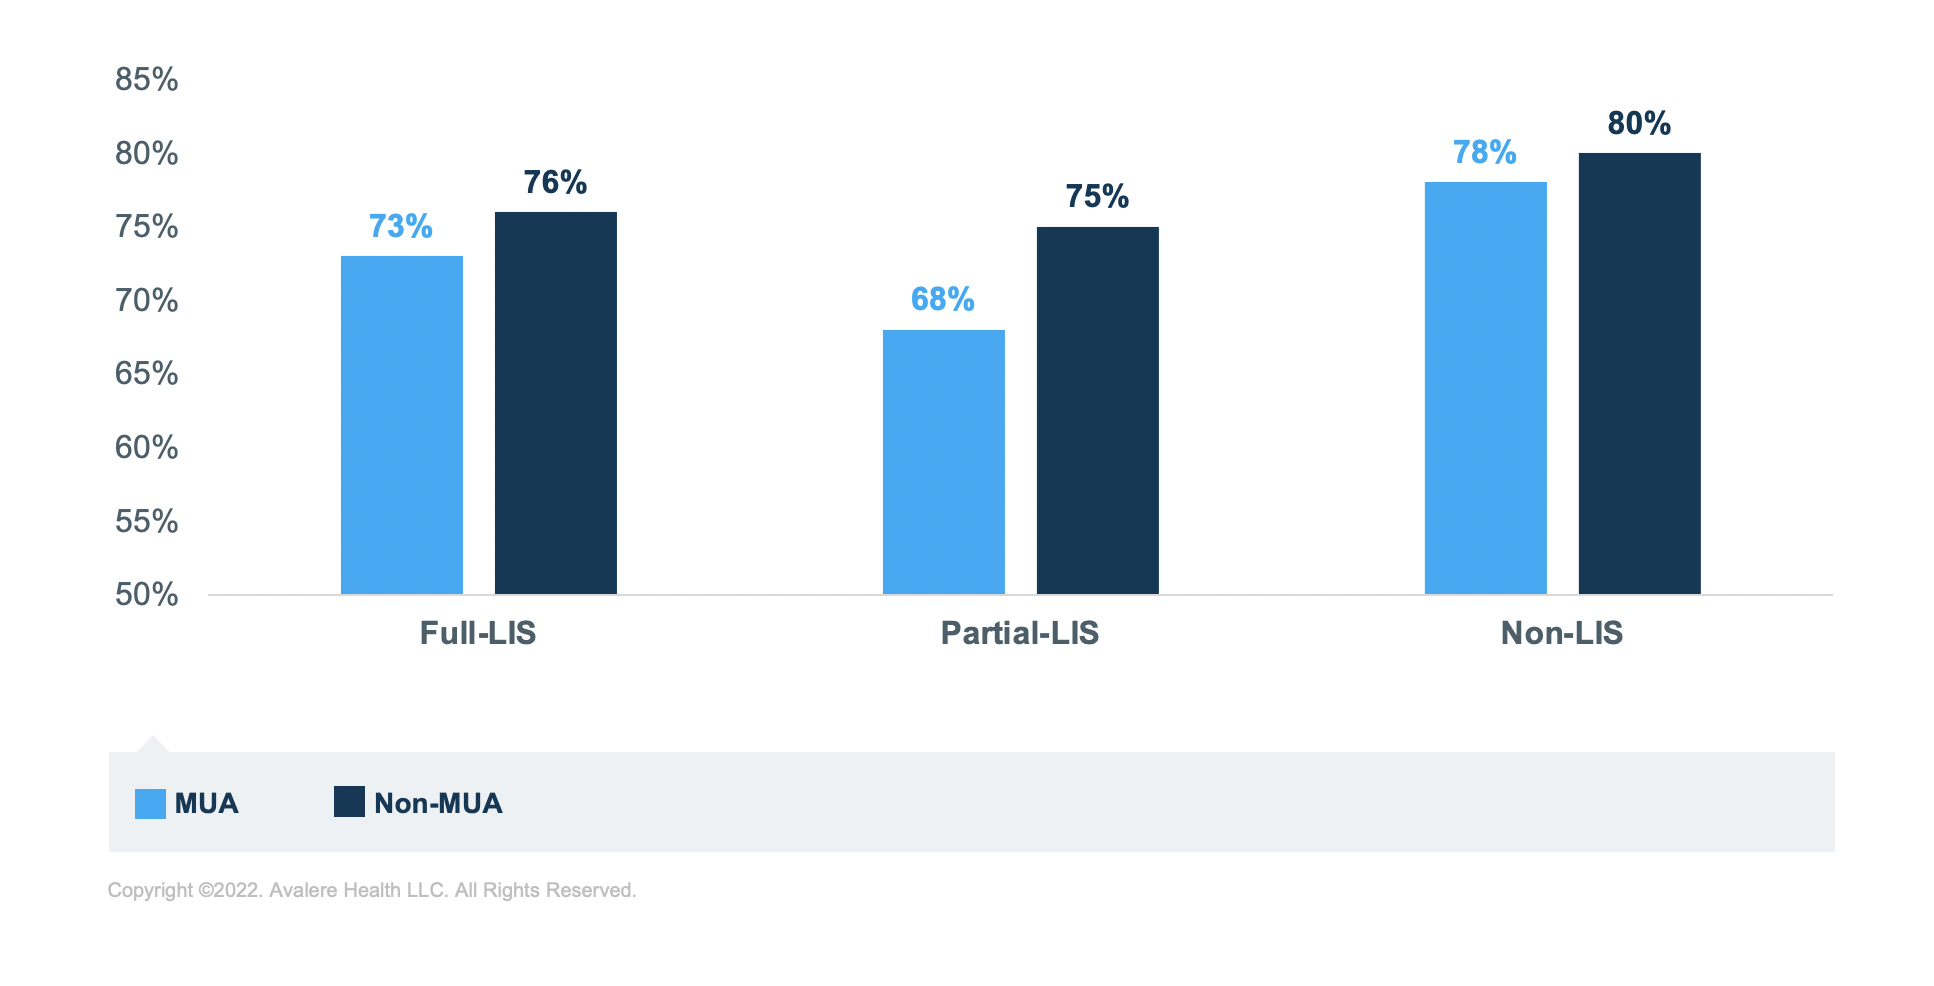
Regardless of MUA status, beneficiaries with LIS have lower rates of sufficient adherence for all 3 disease groups compared to those without LIS. For example, in MUAs, a 10-percentage point difference in adherence exists between non-LIS (78%) and partial-LIS (68%) beneficiaries who take diabetes medications. Beneficiaries in MUAs with full LIS who take diabetes medications are at the mid-point (73%) between these 2 groups.
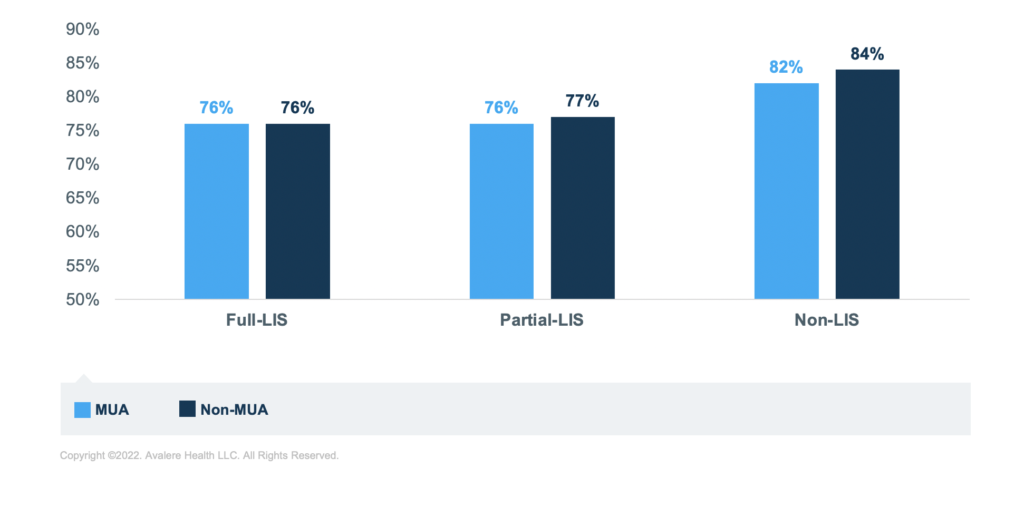
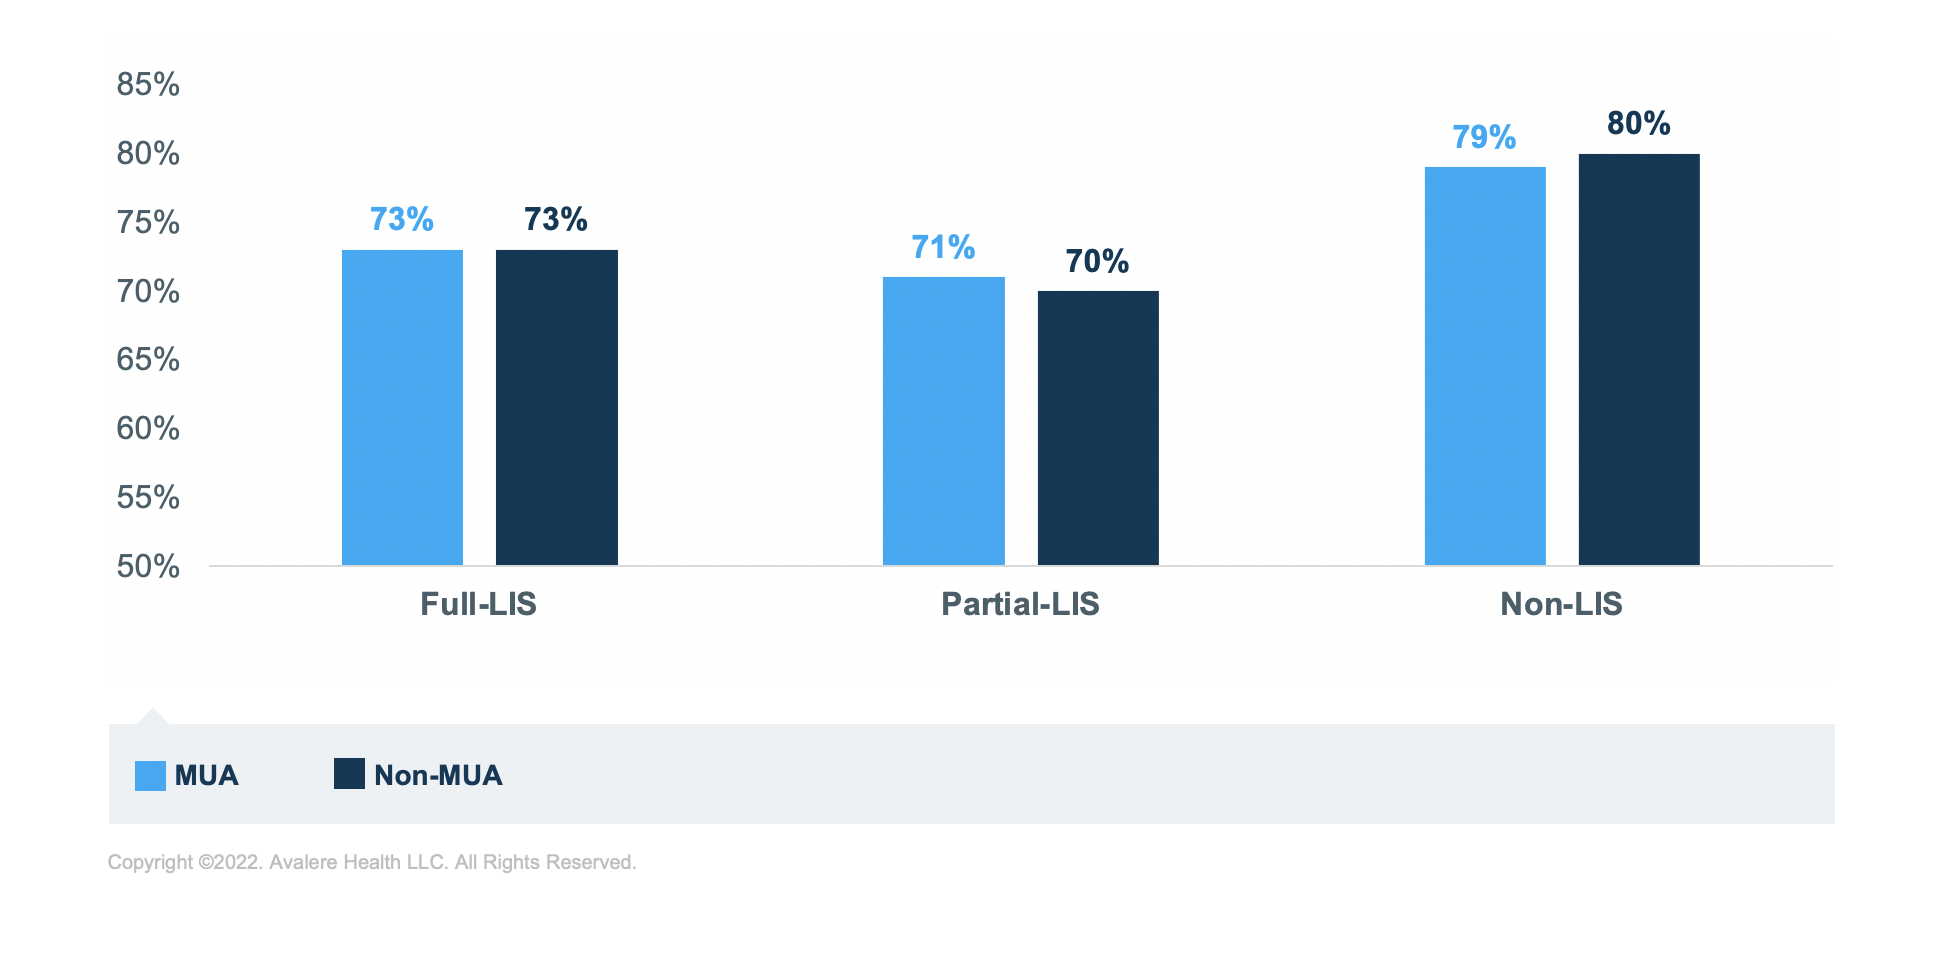
Further, for those taking diabetes medications, living in an MUA correlates to lower rates of sufficient adherence for each of the income groups. The group of beneficiaries taking diabetes medications with the lowest rate of sufficient adherence is the partial-LIS beneficiaries. In fact, across all 3 medication groups, those with partial LIS have the lowest rates of sufficient adherence across income groups, though rates are closer to the full LIS for those taking RASA medications.
Race
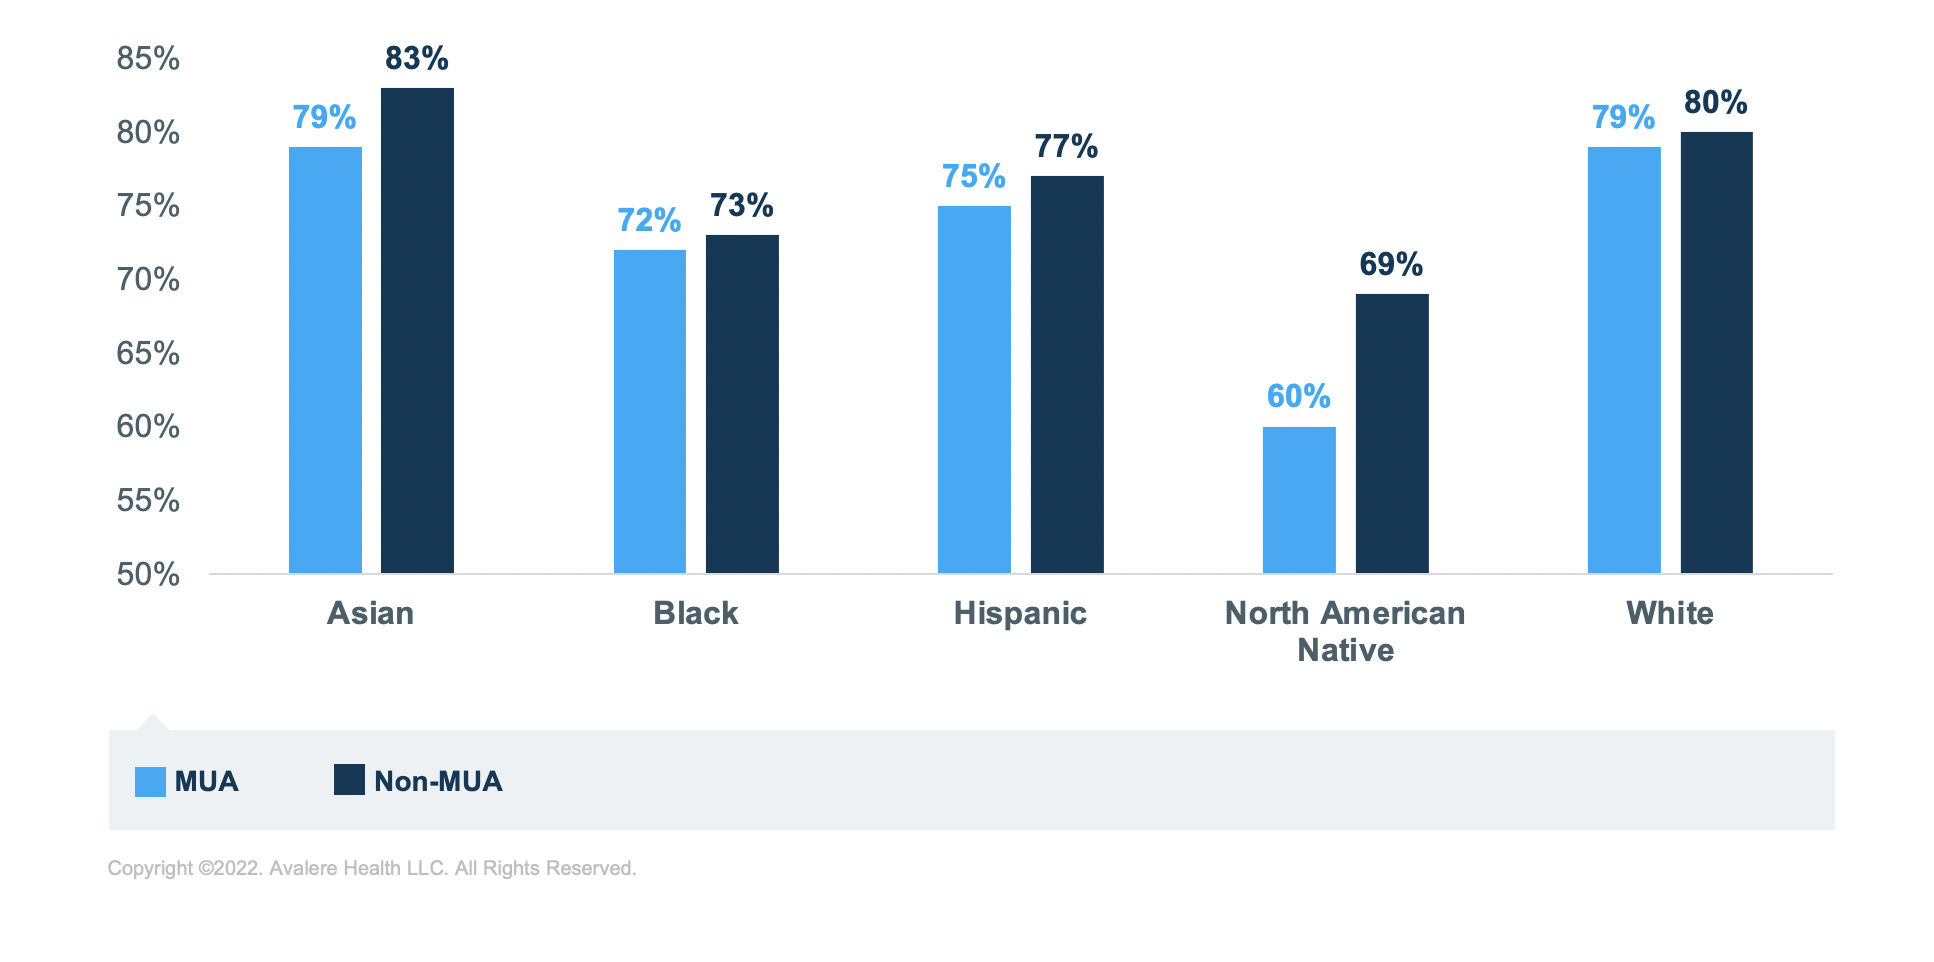
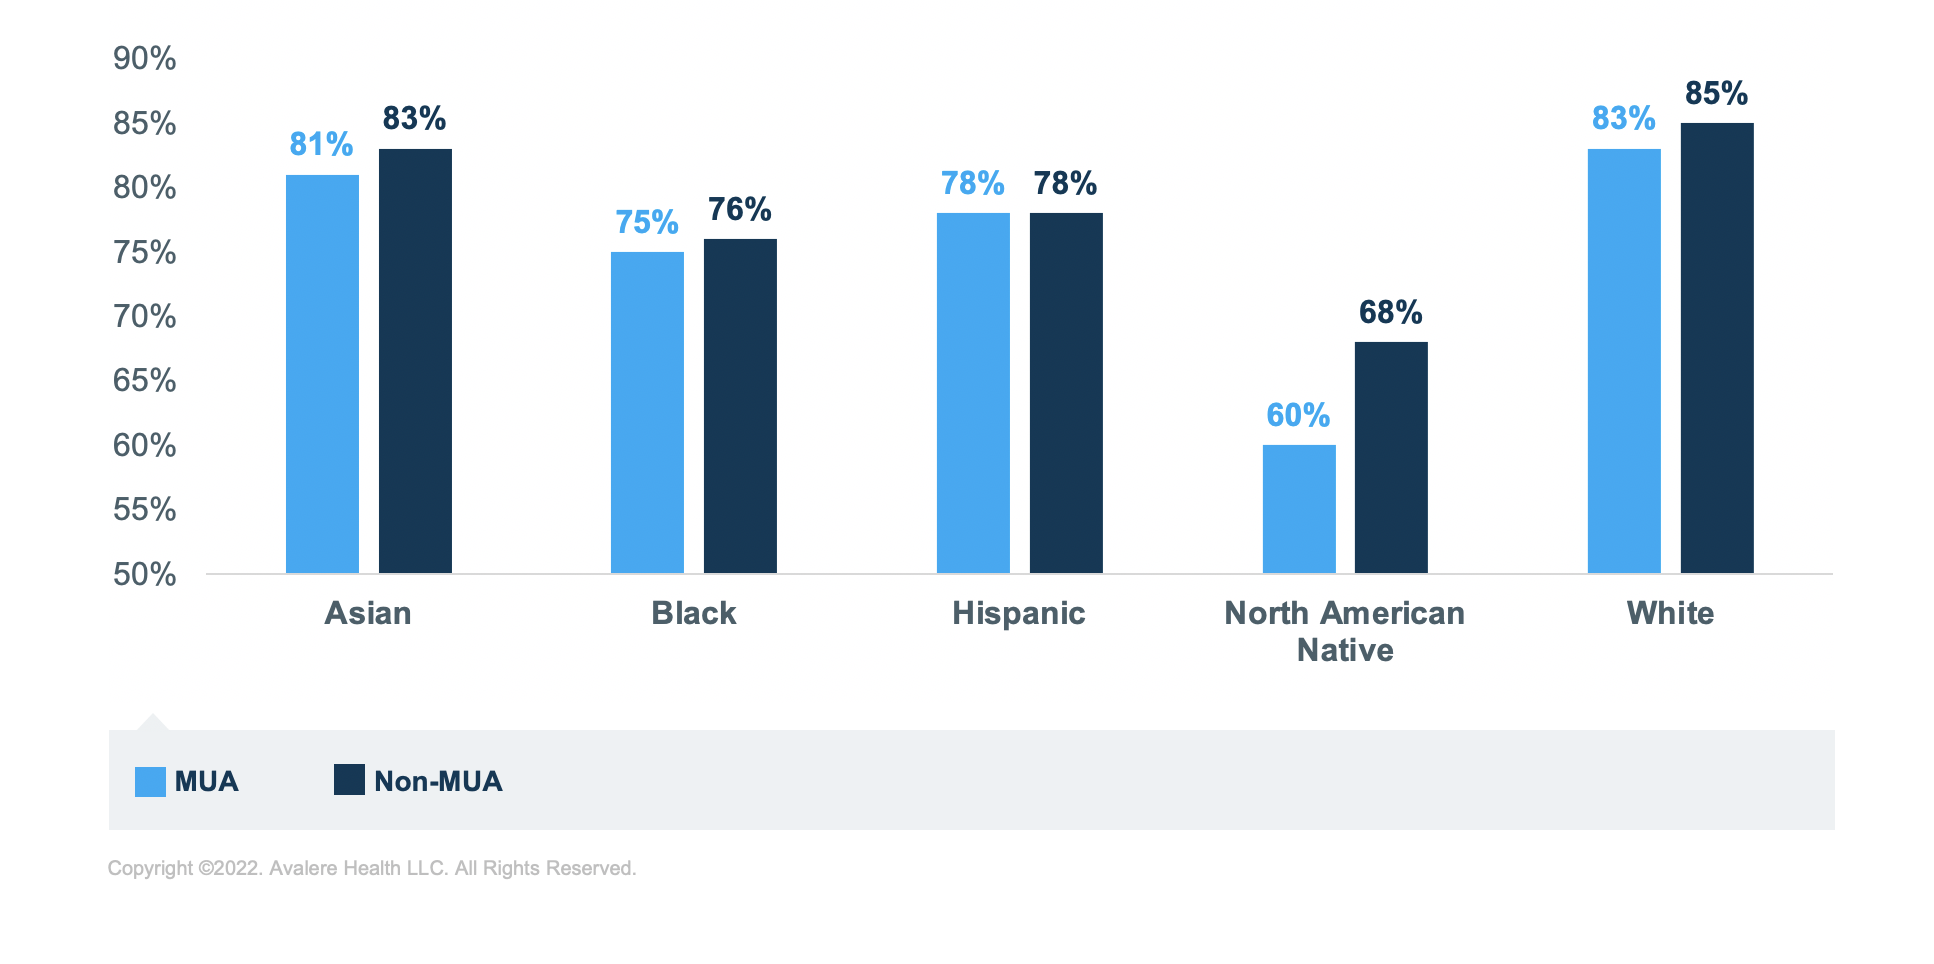
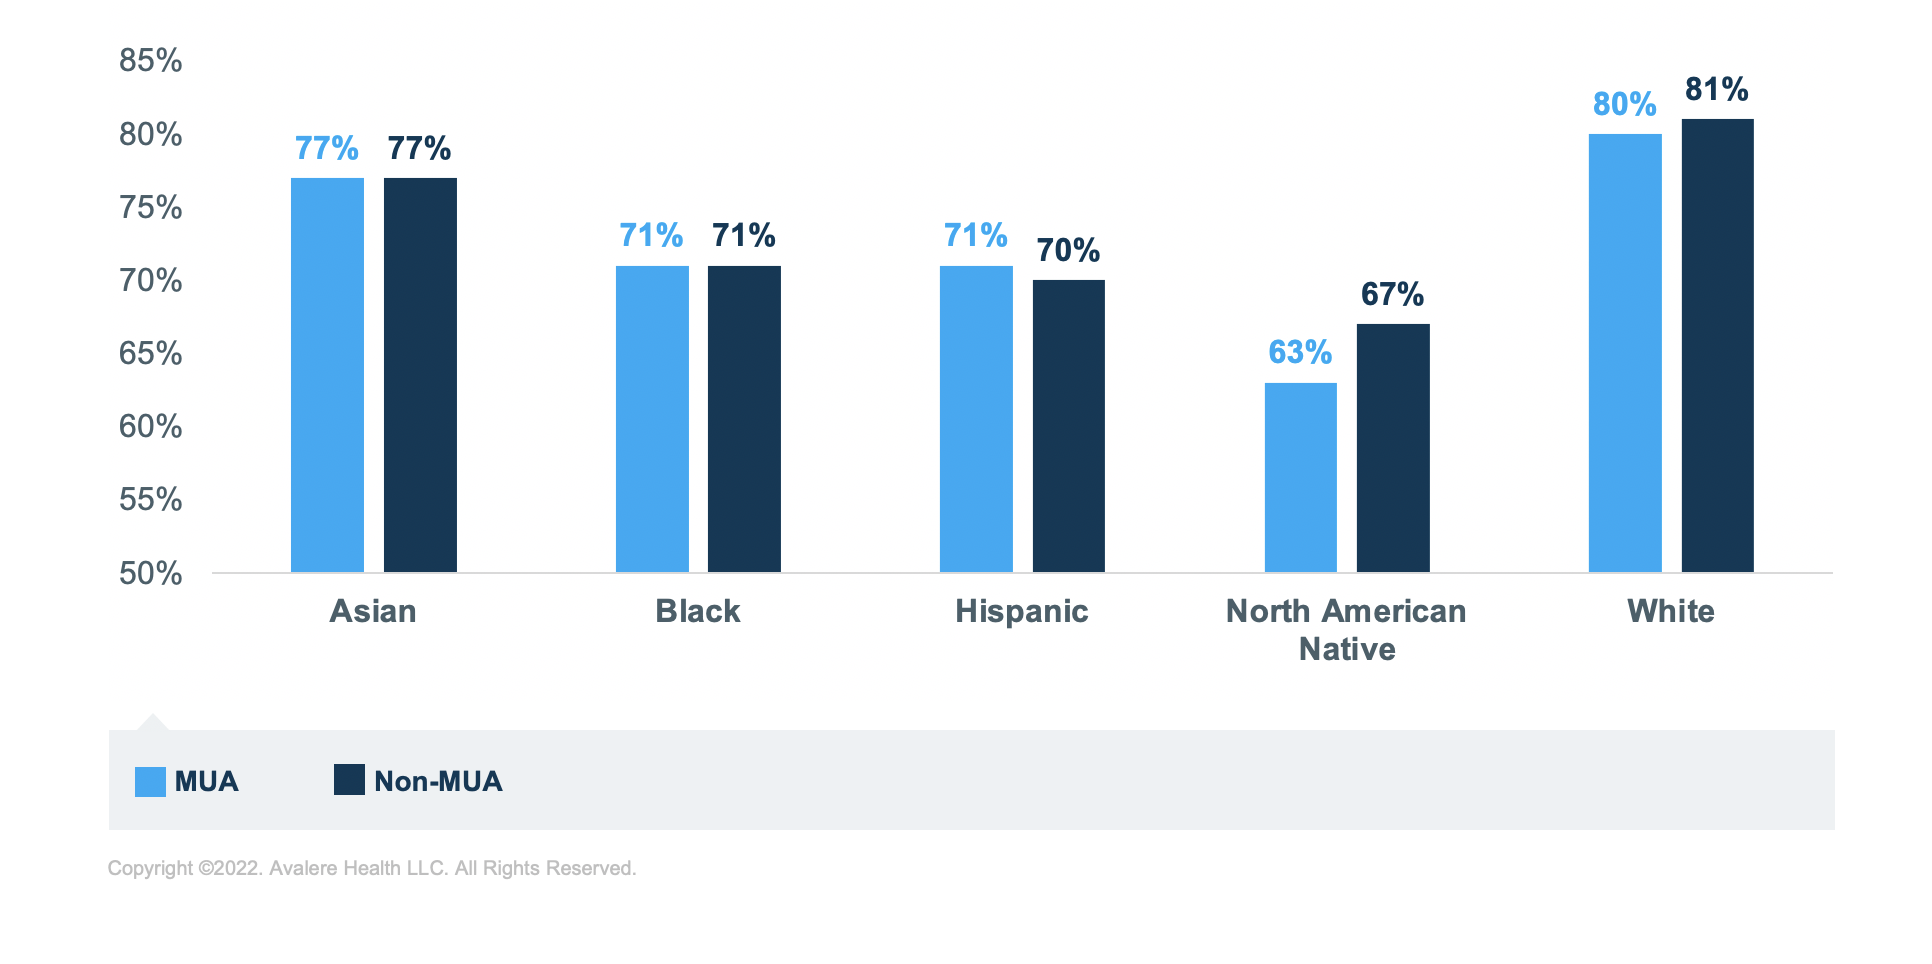
Regardless of MUA status or medication group, Black, Hispanic, and North American Native beneficiaries have the lowest rates of sufficient adherence compared to Asian and White beneficiaries. North American Native beneficiaries have the lowest rates of sufficient adherence across all analytic groups. The greatest disparity in adherence rates is for those taking RASA medications; North American Native beneficiaries have the lowest rate of sufficient adherence in MUA (60%) and non-MUAs (68%) compared to White beneficiaries in MUAs (83%) and non-MUAs (85%; Figure 5).
Discussion
This analysis offers insight into the intersection of race, LIS status, MUA, and medication adherence for beneficiaries taking 3 groups of medications. These findings indicate that social determinants and income could correlate with rates of sufficient adherence.
The results suggest that MUA status may be linked to adherence rates for some conditions (e.g., diabetes) more than others and for some racial minority groups (e.g., North American Native) more than others. This analysis leveraged Part D claims data only; thus, prescriptions being filled by the Indian Health Service would not be reflected in this analysis. This limitation might offer some explanation for rates of sufficient adherence for North American Natives included herein.
Further, the lower rates of sufficient adherence found for partial-LIS beneficiaries suggest that the cost-sharing requirements for those with partial LIS may not subsidize out-of-pocket costs to the extent necessary to achieve adherence rates in parity with other groups of beneficiaries.
Funding for this research was provided by The Pharmaceutical Research and Manufacturers of America. Avalere retained full editorial control.
To receive Avalere updates, connect with us.
Methodology
After identifying MUAs6 and urban and rural areas utilizing HRSA data files, Avalere cross walked these designations to ZIP codes.7 To measure adherence, Avalere analyzed a randomly selected 20% sample of the 2019 Part D Drug Event data from the Centers for Medicare and Medicaid Services to determine the PDC as defined by PQA as a measure of medication adherence for 3 selected medication categories: diabetes, RASA, and statins.8 This allowed Avalere to assess drugs that treat 3 different chronic conditions: diabetes, hypertension, and hyperlipidemia.
The analysis is subject to some limitations. Because MUAs are designated at the county, county subdivision, and census tract levels, the ZIP code analysis may be capturing portions of an area that may not be part of an MUA and could potentially overstate or dilute the differences in the results between MUAs versus non-MUAs. Avalere also excluded beneficiaries residing outside the 50 states and DC, as well as those enrolled in the Limited Income Newly Eligible Transition Program.
Per the data use agreement’s requirement, Avalere identified a random sample representing less than 20% of the total Part D population. Avalere did not include beneficiaries in the US territories, and beneficiaries who were enrolled in the Limited Income Newly Eligible Transition Program were excluded from this analysis
Notes
- Technical Specifications for PQA-Endorse Measures, February 2018.
- Eaddy MT, Cook CL, O’Day K, Burch SP, Cantrell CR. How patient cost-sharing trends affect adherence and outcomes: a literature review. PT. 2012; 37(1): 45-55.
- Vignon Zomahoun HT, de Bruin M, Guillaumie L, Moisan J, Grégoire JP, Pérez N, Vézina-Im LA, Guénette L. Effectiveness and Content Analysis of Interventions to Enhance Oral Antidiabetic Drug Adherence in Adults with Type 2 Diabetes: Systematic Review and Meta-Analysis. Value Health. 2015 Jun; 18(4): 530-40.
- Gast A, Mathes T. Medication adherence influencing factors—an (updated) overview of systematic reviews. Syst Rev 8, 112 (2019). https://doi.org/10.1186/s13643-019-1014-8.
- Based on the PQA Manual, a measurement period includes treatment periods that are at least 91 days.
- The MUA designation is based on county, county subdivision, and census tract.
- Avalere utilized the Department of Housing and Urban Development US Postal Service ZIP code crosswalk files.
- Technical Specifications for PQA-Endorsed Measures, February 2018.


