Treating Depression Reduces Medicare Costs; Provider Challenges Remain
Summary
A recent Avalere analysis of Medicare Fee-for-Service (FFS) data illustrates that treating major depressive disorder (MDD) in Medicare-eligible beneficiaries results in a 4% reduction in total cost compared to untreated patients, highlighting the importance of incentivizing adequate provider supply and payment in the geriatric psychiatry market.Behavioral health treatment has received growing attention in recent years as a method of both improving patient quality of life and reducing healthcare costs. Notably, while the Medicare-eligible population is expected to grow by 55% through 2030, the supply of geriatric psychiatrists remains inadequate and is contracting, with an estimated national average of only 2.6 geriatric psychiatrists per 100,000 state population aged 65 and older⁴. A recent Avalere analysis of Medicare FFS data illustrates that treating MDD in Medicare-eligible beneficiaries results in a 4% reduction in total cost compared to untreated patients, highlighting the importance of incentivizing adequate provider supply and payment in the geriatric psychiatry market.
Current Provider and Payment Environment
Based on an analysis of the American Medical Association Physician Masterfile, the University of Michigan Behavioral Health Workforce Research Center assessed the distribution of the US psychiatric subspecialist workforce.
The analysis focused on several different state and country aspects of psychiatric supply, though the most notable findings highlight the supply of psychiatric providers per affected population across relevant age and payer groups. The pertinent number of providers per age group is:
- A national average of 12.9 general psychiatrists per 100,000 state population
- A national average of 14.9 child and adolescent psychiatrists per 100,000 state population under the age of 18
- A national average of only 2.6 geriatric psychiatrists per 100,000 state population aged 65 and older
With this relative dearth of geriatric providers in mind, it is also important to highlight recent trends in mental health procedure payments and general inflation, which illustrate:
- An average annual Medicare FFS physician payment rate increase of 1.2% across 10 common mental health related codes, from 2017 to 2022 (Medicare Physician Fee Schedule, 2017–2022; individual CPT codes included in Table 1)
- An average rate of inflation of 2.5% from 2017 to 2021
- A recent Avalere survey, in which private health plans cited low reimbursement rates for behavioral health services as a key barrier in establishing and maintaining behavioral health network adequacy
In aggregate, these figures highlight the relative lack of geriatric focused providers compared to general psychiatrists, as well as the modest if inadequate payment updates under Medicare FFS when compared to rates of inflation.
Avalere Analysis of Treatment Cost Impact
To assess the impact of behavioral health treatment in the Medicare population, Avalere leveraged the 100% Medicare FFS data file (accessed via a research-focused data use agreement with the Centers for Medicare & Medicaid Services) to evaluate how cost and outcomes for Medicare patients with newly diagnosed MDD compared, leveraging 2 comparable cohorts that either did or did not receive behavioral health treatment.
The goal of the assessment was to evaluate and characterize how behavioral health treatment (or non-treatment) impacted beneficiary cost when comparing a 24-month follow up period to a 12-month baseline period.

In comparing treated and untreated patient populations over the baseline and follow-up periods:
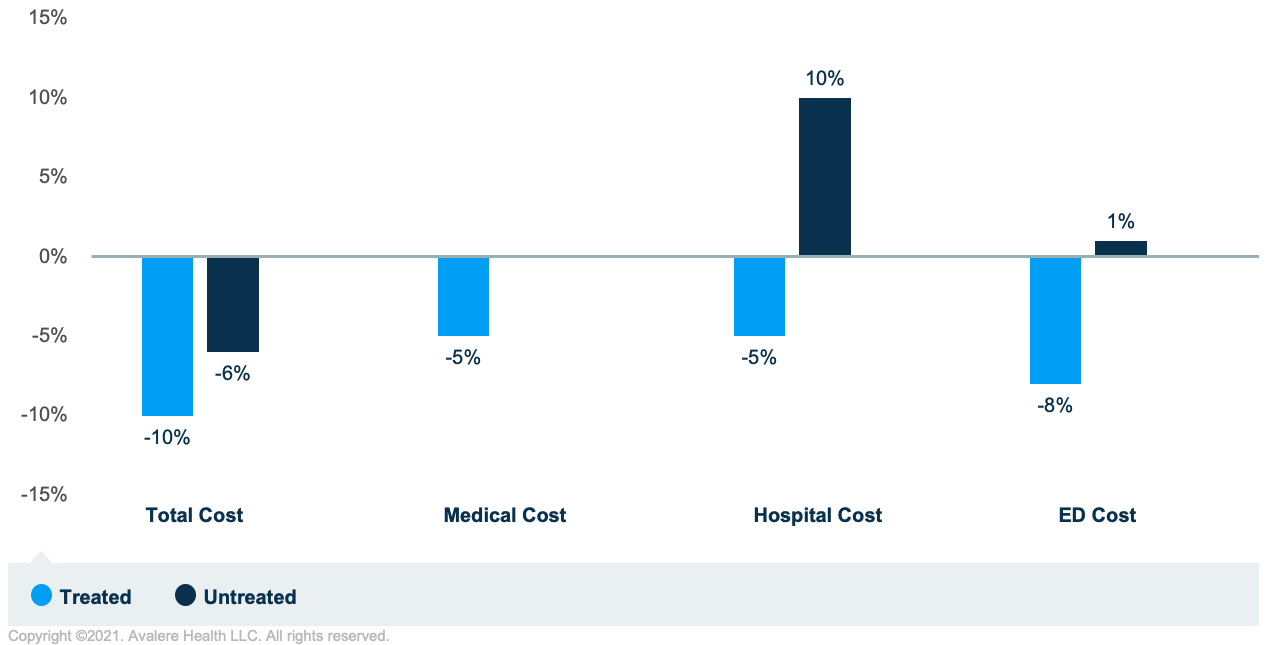
- Total treated per member per month (PMPM) costs declined 10%, compared to the untreated PMPM costs declining only 6%
- Treated PMPM medical costs declined by 5%, while untreated medical costs were unchanged
- Treated PMPM hospital costs declined by 5%, while untreated hospital costs increased by 10%
- Treated PMPM emergency department costs declined by 8%, while untreated emergency department costs increased by 1%
In total, Avalere’s analysis suggests that mental health treatment for Medicare beneficiaries with newly diagnosed MDD can improve beneficiary costs across several metrics of total, medical, hospital, and emergency department related costs.
Outlook
Avalere’s analysis highlights the positive impact that mental health treatment can have on Medicare FFS patient costs for certain patient populations, and further illustrates the need for Medicare payment stability in attracting providers to serve the geriatric psychiatry market.
To receive Avalere updates, connect with us.
Supporting Material
| HCPCS | Descriptor | 2017 | 2018 | 2019 | 2020 | 2021 | 2022 |
|---|---|---|---|---|---|---|---|
| 90791 | Psychological diagnostic evaluation | $132.07 | $136.08 | $140.19 | $145.44 | $180.75 | $173.66 |
| 90832 | Psychological treatment with patient, 30 minutes | $64.24 | $66.24 | $68.47 | $71.10 | $77.81 | $75.58 |
| 90834 | Psychological treatment with patient, 45 minutes | $85.42 | $88.56 | $91.18 | $94.55 | $103.28 | $99.76 |
| 90837 | Psychological treatment with patient, 60 minutes | $128.12 | $132.48 | $136.95 | $141.47 | $152.48 | $146.45 |
| 90838 | Psychological treatment with patient, w e/m, 60 min | $111.25 | $115.56 | $118.57 | $121.26 | $119.33 | $114.88 |
| 90846 | Family psychological treatment without patient, 50 min | $103.36 | $106.92 | $110.28 | $103.58 | $99.10 | $95.40 |
| 90847 | Family psychological treatment with patient, 50 min | $107.31 | $111.24 | $114.60 | $107.19 | $102.59 | $98.75 |
| 90853 | Group psychotherapy | $25.84 | $26.64 | $27.39 | $28.15 | $27.57 | $26.54 |
| 90875 | Psychophysiological therapy | $62.45 | $64.08 | $64.87 | $63.52 | $62.11 | $59.79 |
| 99404 | Preventive counseling, individual | $112.69 | $114.84 | $115.69 | $116.93 | $114.80 | $111.18 |
| 2017 | 2018 | 2019 | 2020 | 2021 | |
|---|---|---|---|---|---|
| Inflation Rate | 2.1% | 2.4% | 1.8% | 1.2% | 4.8% |
| 2017 | 2018 | 2019 | 2020 | 2021 | |
|---|---|---|---|---|---|
| Population | 56.8 | 58.2 | 59.8 | 61.2 | 62.7 |


